Machine Learning with Python: Foundations
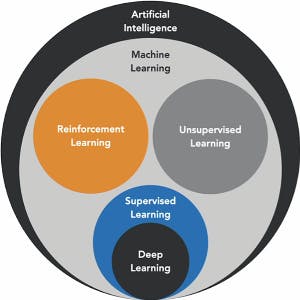
A child learns walking by failing. How does a machine learn? AI the same as Deep Learning; Statistical modeling the same as Machine learning?
- Traditional programming :-
(Input + Instructions) -> Computer -> Output
In 1959, Arthur Samuel came up with something! wondering if computers can infer logic instead of given explicit instructions.
Input -> Computer <- Output
- Give the computer just the input data and also the end result of previously accomplished tasks. Can a computer predict the best instructions that would yield the given output based on the data provided to it?
- Trained model :- a model that has learned the right set of instructions for a set of tasks
- Types of Machine Learning,
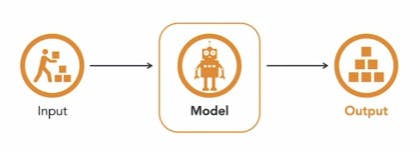
- Supervised Learning - solves known problems, uses a labeled data set to train an algorithm resulting in a trained model, which further is used to predict outcomes. Image recognition, text prediction, spam filtering etc.
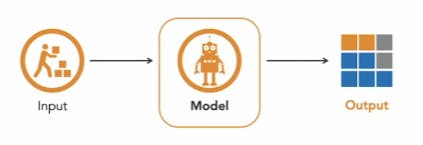
- Unsupervised Learning - simply ask the machine to evaluate the input data and identify any hidden patterns or relationships that exist in the data. Used in movie recommendations, customer segmentation for marketing purposes etc.
- Reinforcement Learning - agent and environment. Agent figures out a best way to accomplish a task through a series of cycles in which the agent takes some action and receives immediate positive or negative feedback on the action from the environment. After a number of cycles the agent eventually learns the optimal sequence of actions to take. Robotics, computer game engines, self-driving cars etc.
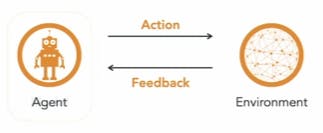
- Supervised Learning - solves known problems, uses a labeled data set to train an algorithm resulting in a trained model, which further is used to predict outcomes. Image recognition, text prediction, spam filtering etc.
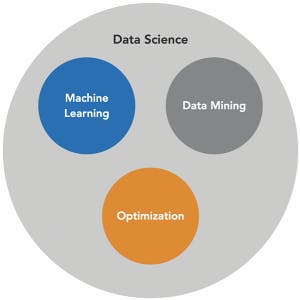
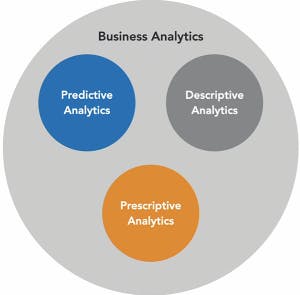
- What is not Machine Learning?
| DATA SCIENCE | BUSINESS ANALYSIS | ARTFICIAL INTELLIGENCE |
 |  |  |
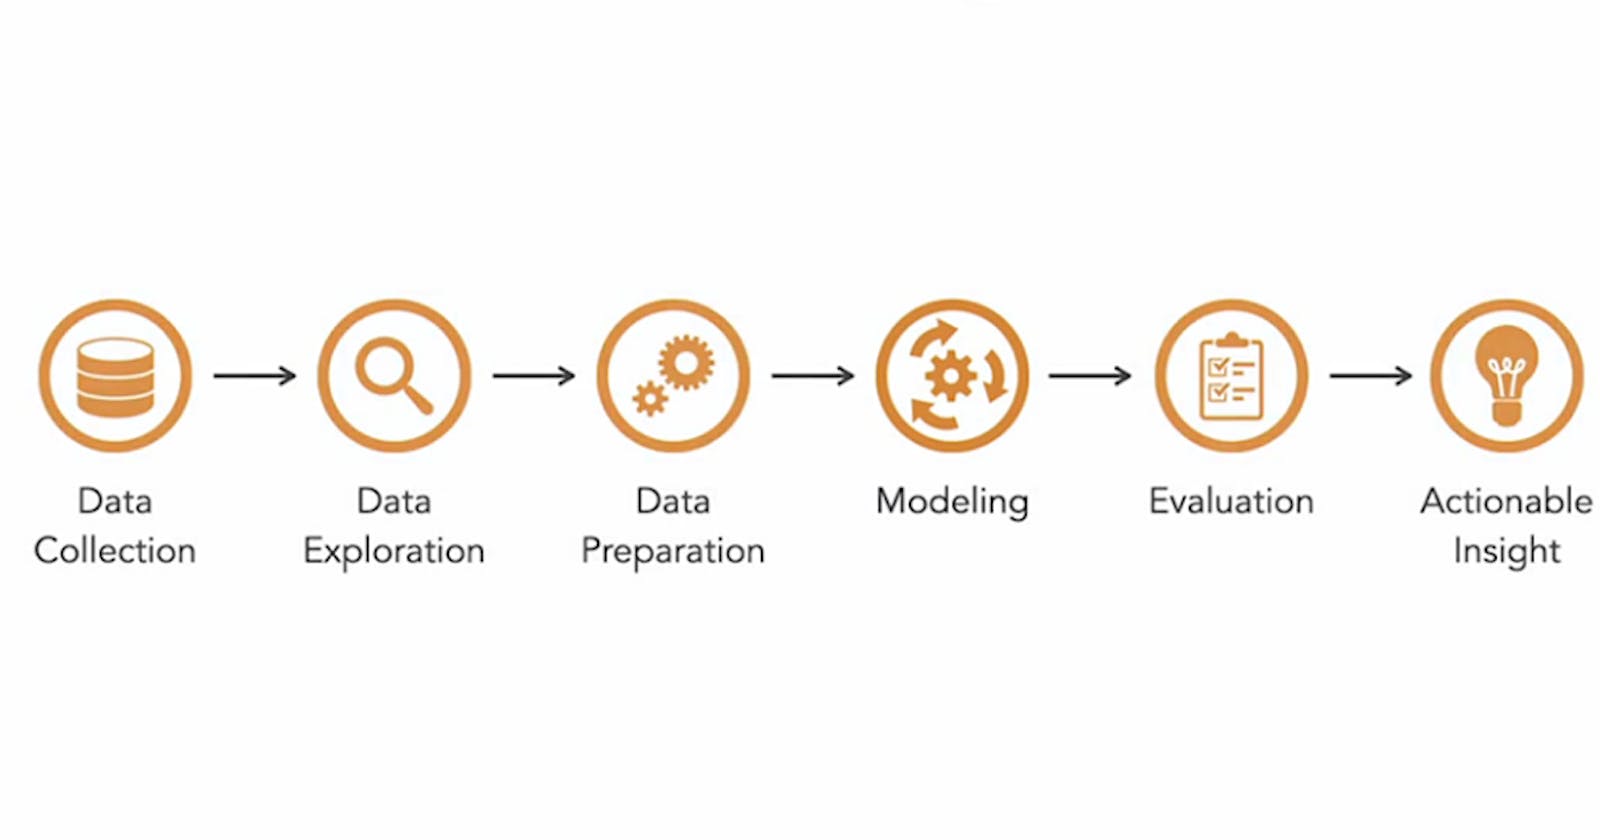
Steps to Machine Learning
(Ex - making a delicious bowl of salad)
Data Collection :- Identify and acquire the data you need for Machine Learning.
- For SL this is the labelled historical data that we intend to use to train and evaluate our model, for UL this is the unlabeled data with unknown patterns that we intend to discover, for RL this is the data that helps our agent learn which actions yield the most rewards.
- Gathering all the ingredients that will go into a salad into a basket
Data Exploration :- Understand your data by describing and visualizing it.
- How many rows and columns are there? What type of values are stored? Are there duplicate values or outliers?
- Inspecting every ingredient to make sure its ripe, fresh and or exactly what we want
Data Preparation :- Modify your data so it is suitable for the type of Machine Learning you intend to do.
- Involves resolving data quality issues, missing data, noisy data, outlier data and class imbalance. Transforming the structure of data ex-normalizing the data, reducing the no of rows and columns.
- We began to cut the veggies depending on the type of salad we want. We may decide to cube, slice or shred the veggies. Grill bake or saute if we are adding chicken
NOTE => 80 % of time is spent in step 1,2,3
Modeling :- Apply a right Machine Learning approach that works well with the data we have.
- In order to apply the right model we must be clear of our objective. Knowing what type of ML we intend to do, what approach is capable and incapable will go a long way.
- Mixing the ingredients that we previously prepared. Depending on the salad we mix more of some ingredient and less of others, we also decide which ingredients to include and which to include or avoid
Evaluation :- Assess how well your Machine Learning approach worked.
- In SL we evaluate a model by measuring how well it does in predicting labels for previously unseen data.
- In UL a good model is one that provides with results that make sense to us.
- We taste and test our salad, if it needs more salt and pepper add seasoning, feels dry we add some dressing
Depending on how well a model performs, we may need to build it again with slightly different data or settings, idea is to make a change that has a meaningful positive impact on the performance of our model. This is an iterative process.
Actionable Insights :- Identify what to do based on the results of Machine Learning approach you chose.
- In Supervised Learning and Reinforcement Learning, at this stage we decide whether or not to deploy our model to production.
- In Unsupervised Learning we decide what to do with the patterns
- Is the salad worth serving it to my guest?
Data Collection
Things to consider when collecting data.
- Accuracy
- Relevance
- Quantity
- Variability
- Ethics
How to Import Data in Python?
- pandas Series - a heterogenous 1 D array like data structure with labelled rows.
- pandas DataFrame - a 2 D data structure with labelled rows and columns. Can be thought as a collection of several pandas Series, all sharing same index. Similar to a RDBMS table or spreadsheet.
Data Exploration
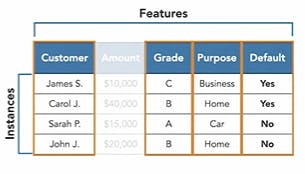
Instance - Each individual independent example of a target concept. Refers to a row of data. Dataset contains several instances. Each instance is described by a set of features/attributes.
Feature - Property or characteristic of an instance. Also called as variables.
- Categorical Feature : attribute that holds data stored in discreet form. Limited to a set of possible values. Ex - Customer name, Grade, Purpose, Default etc.
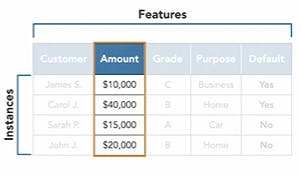
- Continuous Feature : attribute that holds data stored as an integer or real number. It has an infinite no of possible values between its lower and upper bounds. Ex - Amount, Temp, Height, Weight, Age etc.
- Categorical Feature : attribute that holds data stored in discreet form. Limited to a set of possible values. Ex - Customer name, Grade, Purpose, Default etc.
Features can also be categorized based on their functions. In SL an attribute/feature (independent variable) can also be described by other features (dependent variable) within an instance. If the dependent variable is categorical then it is called a Class, however it is continuous it is called Response.
- Dimensionality - number of features in a dataset. High dimension means more detail about each instance, leads to higher computational complexity.
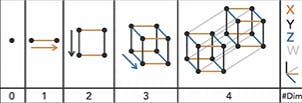
- Sparsity and Density - if 20% data is missing we say that dataset is 20% sparse. They are complementing.
- Dimensionality - number of features in a dataset. High dimension means more detail about each instance, leads to higher computational complexity.
Question ? Why is age a continuous feature? when we can only have 120-125 maximum values.
How to Summarize Data in Python
- Simple aggregations
- Group-level aggregations
How to Visualize Data in Python
- Comparison. Ex-boxplot
- Relationship. Ex-scatterplot, line charts
- Distribution. Ex-histogram
- Composition. Ex-pie charts, bar charts
Common Data quality issues
Garbage in => Garbage out
- Missing data - solved by imputation. Imputation is the use of systematic approach to fill in missing data by using the most probable substitutable value.
- Outliers - data points that are significantly different from most other instances.
- Class Imbalance - well known problem in Machine Learning, occurs when the distribution of values for the class is not uniform.
Normalize data / Data preparation
Different ways
- Z-Score Normalization
- Min-max Normalization
- Log Transformation (if data consists of outliers)
Q. Which of these normalization techniques should you avoid if you have negative values in your data? Log Transformation
Sampling the data
- Sampling is the process of selecting a subset of the instances in a dataset as a proxy for the whole.
- Original dataset is referred to as the population, while the subset is known as a sample.
- Different ways,
- Random Sampling without replacement
- Random Sampling with replacement
Bootstrapping - important technique in Machine Learning, evaluate and estimate the feature performance of a Supervised Learning when we have very little data.
- Stratified Random Sampling
Q. Which of these sampling techniques maintains the same class distribution between the sample and the population? Random Sampling with replacement
Dimensionality Reduction process
- The process of reducing the number of features of a dataset prior to modeling.
- Reduces complexity and helps avoid the curse of dimensionality.
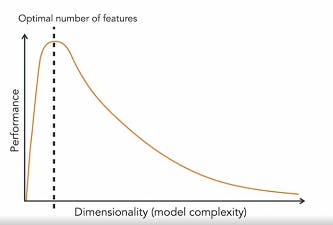
describes the eventual performance reduction of a model as the dimensionality of the training data increases.
- Approaches to perform Dimensionality reduction,
Feature Selection (variable subset selection) :- identify minimal set of features needed to build a good model.

Feature Extraction (feature projection) :- use math functions to transform high-dimensional dataset into lower dimensions. results in a final set of features that are completely different from the original one.
very efficient method but the values for newly created features are not easy to interpret, and make no sense.
| Before | After |
 |  |
Modeling
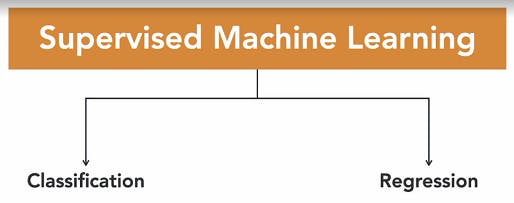
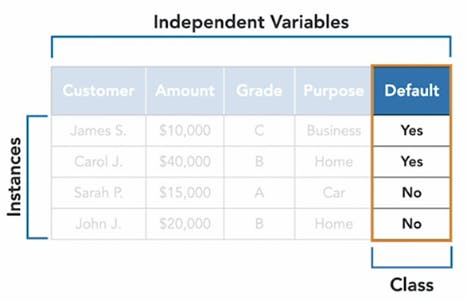
Classification :-
- Supervised machine learning problem where the dependent variable is categorical.
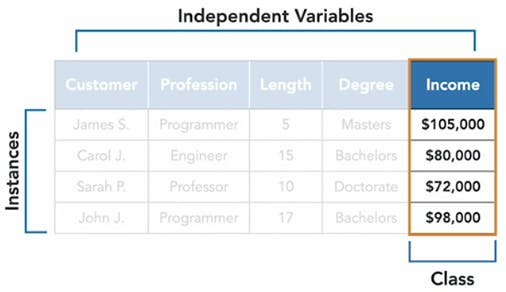
Regression :-
- Supervised machine learning problem where the dependent variable is continuous.
Evaluation
Training data and test data
In order to get an unbiased evaluation on the performance of our model, we must train the model with a different dataset from the one we used to evaluate it.
- Step 1 = Training data
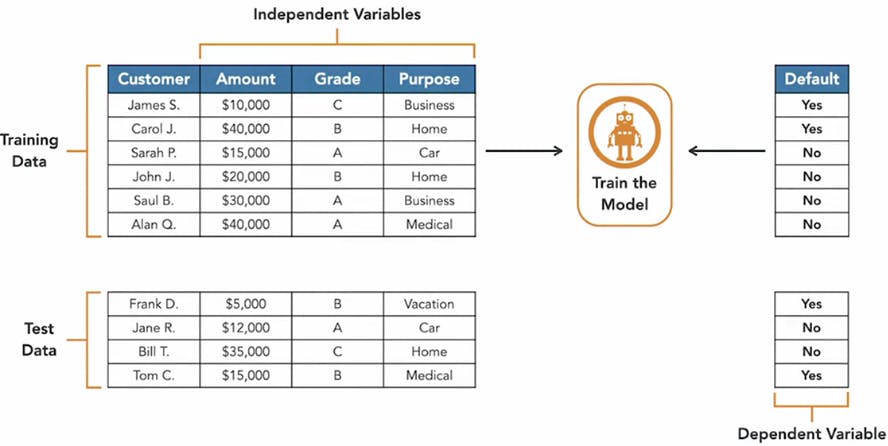
- Step 2 = Test data
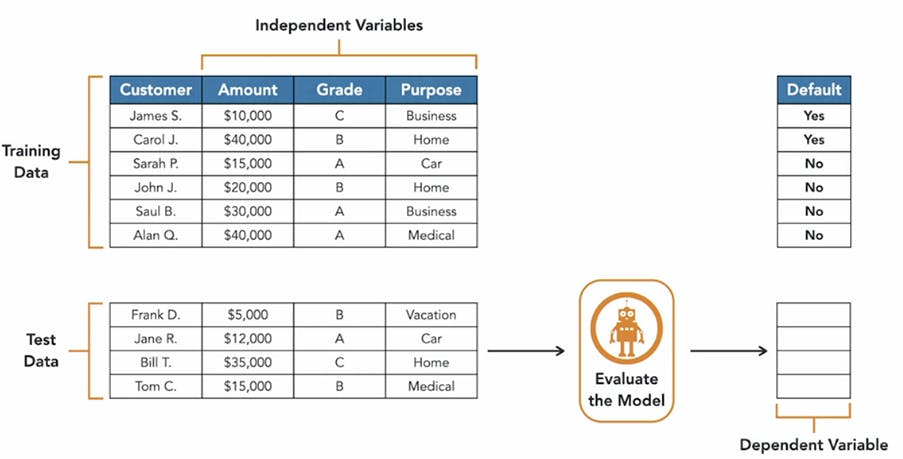
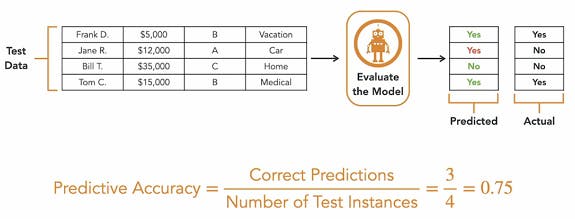
Predictive accuracy :- For a classification model we use predictive accuracy as a measure of how well the model does.
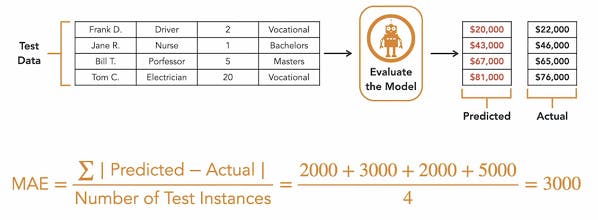
- Mean Absolute Error (MAE) :- For a regression model we use MAE
